Surveying, Mapping and GIS

Exploring all aspects of mapping and geography, from field data collection, to mapping and analysis, to integration, applications development and enterprise architecture...

  • Geospatial Technology, End to End...

    Exploring all aspects of mapping and geography, from field data collection, to mapping and analysis, to integration, applications development, enterprise architecture and policy
Showing posts with label emergency response. Show all posts

Mapping for Haiti Earthquake Response

Posted by Dave Smith On 1/18/2010 04:30:00 PM 2 comments


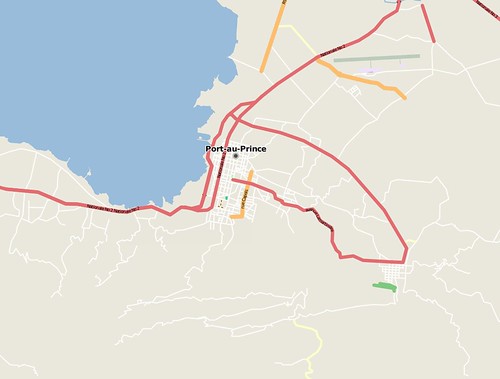
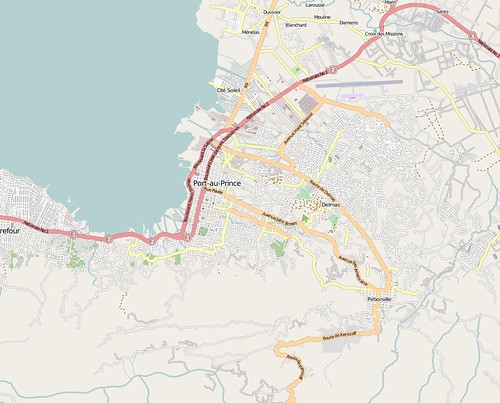
For the last few days I have been working on efforts to help Haiti earthquake response - part of this is mapping Haiti via OpenStreetMap. Currently, useful maps of Haiti are few and far between, in some case there are detailed maps for parts of the country and cities like Jacmel, but which are print maps (no digital edition exists), in many cases many decades old and outdated, in other instances the only maps which exist are small-scale, with limited detail. Commercial map platforms like Bing Maps, Google Maps and Yahoo vary greatly in their detail as well, and update cycles are slow - however, here, OpenStreetMap has been able to rapidly respond and provide very speedy and robust updates, to include capturing data about collapsed buildings, and so on.

Mikel Maron captures the speed and effectiveness of OpenStreetMap with these two screenshots of Port-Au-Prince, just before the earthquake and just after:

before:


after:


I would encourage any others who have time to contribute to get involved in this effort as well - editing can be done directly in OpenStreetMap via the 'edit' tab, which opens a web-based tool called Potlatch - or, a number of other tools are available as well. (You will need to register an account in order to edit - feel free to connect with me there as well - http://www.openstreetmap.org/user/Dave%20Smith). The OpenStreetMap WikiProject Haiti page provides a lot of good information and frequent updates. A number of data sources have been assembled, together with fresh post-earthquake imagery generously donated by companies like DigitalGlobe.

For folks who are interested in more robust tools, I primarily use Merkaartor which runs best on Windows platforms - others favor JOSM which is Java-based and runs on any platform supporting Java.

With either of these, you should be able to use the download function to navigate to an area of Haiti (select a relatively small area) and then download the OSM data

Some have wrestled with getting the various available imagery and map services to work properly in JOSM and Merkaartor - they are both a bit clunky about accessing WMS servers - I can offer some of my tips gleaned from a little debugging using Fiddler2: For Merkaartor, use Tools -> WMS Servers Editor and create a new entry with the following URL: http://maps.geography.uc.edu/cgi-bin/mapserv?map=/home/cgn/public_html/maps/mapfiles/haiti.map&version=1.1.0&SERVICE=WMS&REQUEST=GetMap? and show capabilities to access the DigitalGlobe CrisisEvent imagery (DG_crisis_event_service), select EPSG:4326 (only option available) and image/png and you should be able to go from there. If there is no image layer showing, go to Layers -> Add new image layer, and then right-click on the newly added image layer and select your newly-added WMS server for DigitalGlobe.

Digitization tasks are fairly intuitive - tools allow you to draw points, lines and polygons, as well as to create relations which allow multiple entities to be grouped together - however the absolute key to success is in proper use of tags to provide attribute values for any entities being created. These are generally intuitive as well, e.g. tag of highway, value of residential to turn a generic line into a residential road. It also helps to look at tagging of existing features, and to familiarize yourself with the features list - the OpenStreetMap wiki is searchable and quite useful. Finally, as terms of using the DigitalGlobe imagery, any data entered using their imagery should also be tagged with source=digitalglobe.

One of the other projects I have been working on is development of a set of tags that would be useful for emergency responders, relief and aid efforts - for this, I have started a wiki page http://wiki.openstreetmap.org/index.php?title=Humanitarian_OSM_Tags- any comments and thoughts can be added to the wiki page.

--- Update: Jan 20 ---

To update, I wanted to also include reference to the video tutorial that Kate Chapman put together on mapping for Haiti, to help demystify the tools:


Thanks to Kate and all the other great folks contributing to the Haiti mapping efforts...

Emergency Response and GIS

Posted by Dave Smith On 6/14/2007 07:23:00 AM 0 comments

One of the other events which will be happening concurrent to the ESRI Conference is the SONS 07 event - "Spill Of National Significance", which will replicate a major catastrophic event - to include simulated release of oil, hazardous material, and/or other associated threats to health and safety. This year's event will take place in the midwest, replicating an earthquake along the New Madrid fault zone.

Through our work with USEPA, we will be among the participants in this event, as we did for Hurricane Katrina, supporting the effort through our own GIS staff at the USEPA Emergency Operations Center. The two main stakeholders and participants on the environmental side are USEPA and USCG, along with FEMA, state, regional and private sector participants to support the response as appropriate.

It's good to see these events take place, and it no doubt will give us many more new lessons learned and opportunities to refine response. The bottom line still comes to being proactive, in terms of GIS preparedness, as opposed to reactive. With regard to availability of information on impacted facilities, we will no doubt be in better condition than we were for Katrina, but many of the other pieces are still lacking. Specifically, there is still little transparency or availability of realtime or near-realtime data, when it comes to assessing response capacity and many other pieces.

Here, we should go back to HSPD-5 which deals with communications and interoperability, and examine how well our GIS assets work together, and how well they support standards, how well-documented they are to allow users to make informed decisions regarding the data.

Closely affiliated and associated with this is HSPD-8 for preparedness - which comes along with a host of other questions - how current, scalable, flexible and robust is your GIS data, and does it address the need? For example, how many burn units are immediately available in a 100-mile radius right now, how many pieces of fire apparatus are available right now - with the right now being key. In looking at a dozen or so counties nearby, I see almost 500 fire stations, almost 200 law enforcement offices, and nearly 200 emergency medical providers. Yes, they participate in surveys and report in data, but how timely is it? Now consider that Pennsylvania has 67 counties, and the scale of the problem magnifies greatly. Say your EOC is impacted, loss of power, loss of communications, otherwise rendered inoperable. Can you cascade your operations over to a COOP site and continue seamlessly?

Here in Pennsylvania, we have many gaps, overlaps and stovepipes for data and communications flow, and many points of failure, from local to local, local to county, county to county, local to state, county to state, between state agencies, local to fed, county to fed, state to fed, and fed to fed. I can't think of any one of these which genuinely works seamlessly with the next. This is what we have been referring to as the gap of pain, and something for which we have a concept and team already up and running to address.
The February 2007 snowstorm, which caused widespread damage and notoriously left hundreds of motorists trapped on Interstate 78 for 20 hours, still remains a major fiasco here in Pennsylvania, with solutions still thoroughly unadressed politically, fiscally and bureaucratically. On the other hand, technologically, we can address the data, communications and preparedness issues. This is something that we have been looking at quite closely ever since 9/11, investing a lot of time and thought into, and something I will be running through again, considering the SONS exercise. It's time to act and become proactive, and to break through the stovepipes and fiefdoms.

USEPA GIS Workgroup

Posted by Dave Smith On 4/22/2007 04:47:00 PM 0 comments

I am looking forward to attending the EPA GIS Workgroup meeting coming up in Boston. This time around, the spring meeting will be in Boston, at the Omni Parker House Hotel, May 15th to 18th.

It will be good to refresh some contacts and make some new ones. We are hoping to make some further inroads in the EPA GIS community, combining our present USEPA geospatial expertise and SDVOSB status to reach out and support USEPA regions and other USEPA program offices. For me, it's also another opportunity to go and visit with my relatives in Massachusetts.

Limnic Eruptions

Posted by Dave Smith On 3/24/2007 10:52:00 AM 1 comments

In examining Rwanda and Cameroon, I came across a number of articles discussing limnic eruptions - this is a natural event, where large amounts of dissolved and trapped gases in lakes suddenly and catastrophically become released, causing death to all living things within a substantial radius of the lake.

Typically this is due to volcanic vents, which release CO2, which becomes trapped in stratified layers deep in the lake. The trapped gases may remain undisturbed and in solution for long periods of time, and may continue to accumulate until an external event triggers instability, such as earthquake, landslide, rapid thermal change, or the like.

One particularly catastrophic and more well-known instance of this phenomenon is Lake Nyos, in Cameroon, where in August of 1986, an estimated 1,800 people and large amounts of livestock died due to suffocation. It is estimated that 1.6 million metric tons of CO2 were released in that instance. As CO2 is heavier than air, the gas fills valleys, and finds its way to low-lying areas in great concentration.

Fortunately this is a relatively uncommon occurrence - few lakes are known to have this type of supersaturation of gases and potential for catastrophic overturn. Lake Nyos is a fairly small lake, of 1.2 km2 - Lake Monoun is another small lake in Cameroon which has had similar catastropic incidents and loss of life in the past.

Another lake that is somewhat disconcerting is Lake Kivu, bordering Rwanda and the Democratic Republic of Congo - Lake Kivu is much larger - 2,700 km2, with a much larger population along its shores than these other lakes. It is unknown if Kivu is susceptible to similar massive overturn events, and Kivu has considerably greater depth that the two Cameroonian lakes, however it similarly displays the unusual supersaturation of gases characteristic of the other two lakes - and situated over the Rift Zone, and in proximity to Mount Nyiragongo, which last erupted in 2002- it is entirely possible that the same circumstances exist for continued contribution of CO2 and other gases.

In some instances, the lakes are being degassed, via pipes which seek to gradually release the concentrated gases, similar to slowly letting the fizz out of a soda can.
One such project is being conducted by the Lake Nyos and Monoun Degassing Project.

Geospatial Data, Security and Protecting the Public

Posted by Dave Smith On 2/14/2007 09:10:00 AM 0 comments

Jeff Thurston at Vector One has posted a great article on geospatial data and the interplay of security, restrictions, and censorship versus freedom, citizen-centric government, and the ever-dynamic geospatial industry. I agree wholeheartedly with him on many aspects of his argument and perspective. I believe that, in an ideal world, access to data should be transparent.

However, I do think that there are more things at stake than just military and homeland security's wishes for data to be controlled. There is also an aspect of protection of the public from accidental misuse of data, and intentional abuse of data. Where harm to the public may be an issue, typically professional licensure, security clearances, or other safeguards come into play.

There are many datasets that can fall into this category - for example, there have been several publicized cases involving the misuse of GIS tax parcel mapping to attempt to enforce such things as building setbacks and other ordinances, to the harm and detriment of property owners who may in retrospect have actually turned out to be in compliance with the ordinances - though in some instances only through costly litigation and/or demolition of a structure. In some instances, actual surveyed boundaries were rejected by undereducated GIS staff or other bureaucrats, in favor of digitized-and-rubbersheeted GIS parcel boundaries or misused COGO routines in the hands of people who do not have a solid understanding of surveying. Clearly this is unacceptable misuse of GIS data.

Among other things, I work extensively with GIS data for facilities, which may contain toxic or hazardous materials - certainly agencies which regulate their activities and emergency responders need to have ready access to what is onsite, and what the consequences of a catastropic event at one of these facilities might be on the community - but aside from keeping this data from the hands of would-be agents of terror, certainly that facility's competitors might be able to gain some competetive edge from knowing what this facility is working with. This is generally known as "Confidential Business Information" (CBI). It is a classified data category apart from the usual Governmental Secret or TS/SCI classification hierarchies.

Another area with tremendous potential for misuse is in traffic incident data - Departments of Transportation collect information on reported accidents and incidents, and plot them on roadway maps - the analysis of this can help the DOT in triaging, prioritizing, budgeting and sequencing improvements to the roadway for safety. However, in the wrong hands, this type of data can also lead to litigation - "you knew this was a bad intersection, yet you didn't do anything". Often a DOT is aware of problems for many years, but given budgetary or organizational constraints may be unable to act on them in as timely a fashion as would be liked - and a multimillion-dollar court award or settlement is generally only going to take away money from being able to address the problem properly.

Another example from personal experience comes from some of the Emergency Response work we had done in conjunction with Hurricanes Katrina and Rita. Here, GIS data on accidental spills and contamination relating to the flood event must be captured, however given Agency issues with cost recovery, along with civil litigation and other issues, often this data must be tightly controlled, to avoid misuse which might undermine cleanup and remediation in the future.

These are just a handful of examples - many more come to mind. GIS is, at the end of the day, just a tool. The ever-emergent plethora of geospatial data and the ubiquitousness of GIS tools available to the public is certainly wonderful, however data and a tool in the hands of one, either without the adequate domain expertise to use the data properly - leading to unintentional harm; or the intentional abuse by one who wishes to exploit the data toward personal gain at expense of the public, or toward the outright, intentional harm of the public, can be a dangerous thing.


In the Amazon Mechanical Turk effort to analyze imagery for potential clues in the disappearance of Jim Gray, I thus far managed to log 185 units of 5 images each, the count was well over 4000 when I started, and the last one I completed said 1 remaining. It was plainly evident that I had a great deal of company throughout this effort.

Certainly there were several instances of images where boats, along with their associated wakes, could be seen in the images, however a great many were difficult to read, with a great deal of reflectance, cloud cover, and so on.

It will be interesting to see what the next steps are - whether more data or additional passes will be offered up through Mechanical Turk, and if any of what participants identified will ultimately be able to correlated to other activity in the vicinity, or indeed provide clues to Gray's location.

UPDATE: Some additional images from a NASA aircraft have been posted to Mechanical Turk - see the following link: http://www.mturk.com/mturk/preview?groupId=J0XZ58STDWJZ5QY4F9M0

I have also located a blog site operated by the folks who have been organizing this effort: http://openphi.net/tenacious/
- They have posted quite a few updates and insights into the nature of the imagery and ongoing effort

The Search for Jim Gray

Posted by Dave Smith On 2/03/2007 10:17:00 AM 0 comments


I have been trying my hand at Amazon's Mechanical Turk - scouring imagery in search of missing Microsoft Research guru Jim Gray. Dr. Gray is the father of TerraServer and many other groundbreaking pursuits at Microsoft. Coast Guard efforts to date have been fruitless, as the story continues to unfold. Through a collaborative effort, recent imagery of the search area has been posted on Amazon's Mechanical Turk, in the hopes that signs of his 40-foot sailboat, life rafts or any other signs can be found, in a collaborative effort.


It is somewhat challenging, as image resolutions and scene conditions for the images I have had are not optimal for finding a 40-foot sailboat, let alone smaller features, such as a liferaft, but it is good to see that efforts like Mechanical Turk are becoming available toward organizing massive human effort toward detection and other tasks.

My hopes and prayers remain with Dr. Gray's family, friends and colleagues.

Take-home goodies...

Posted by Dave Smith On 1/13/2007 07:40:00 PM 0 comments

Having a five-year-old in the house, I usually snag any little conference goodies, such as the LizardTech lizards, yo-yos, and other things of interest... And ESRI never fails to please with a few goodies of their own at the User Conferences.

One interesting one is the Mapping for Congress book, published by ESRI press, it was distributed in the conference bags at sign-in. In usual case-study style, they present a gallery of interesting maps that were developed in response to various Congressional inquiries and toward exhibits and policy development by the Library of Congress Congressional Cartography Program. Plenty of great studies toward support of public policy, social justice and other areas to be found in this book.

Another one that I grabbed at the conference was GIS for Homeland Security, which in a vest-pocket size, provides a good high-level overview of various initiatives, Homeland Security Presidential Directives, and other ongoing efforts toward preparedness and response. A great feature of this book is the extensive glossary, which provides over 30 pages of definitions and explanations of the various terms, definitions and TLAs (three-letter acronyms) that one encounters in the Homeland Security arena.

What appears to be a real gem that was handed out in the conference bags is Standards for Success: GIS for Federal Progress and Accountability which as a sort of follow-on to Measuring Up: The Business Case for GIS - it is of particular interest to me, as it presents many federal geospatial projects - and here, the business case needs to begin getting aligned with the OMB GeoLoB, Agency Blueprints, FEA, CPIC and other directions. This book doesn't appear to touch on these directly, but does provide a high-level overview that is spot on, when it comes to streamlining business, collaboration, business logic and decision support, and optimal use of resources.

Going to have to read that one in a bit more detail.


Technorati tags:
, , , , , , , , , , , , , , , , , , , , , , , , , , , , , ,


Search