Surveying, Mapping and GIS

Exploring all aspects of mapping and geography, from field data collection, to mapping and analysis, to integration, applications development and enterprise architecture...

  • Geospatial Technology, End to End...

    Exploring all aspects of mapping and geography, from field data collection, to mapping and analysis, to integration, applications development, enterprise architecture and policy
Showing posts with label election. Show all posts

Red States, Blue States...

Posted by Dave Smith On 11/06/2008 11:27:00 PM 0 comments

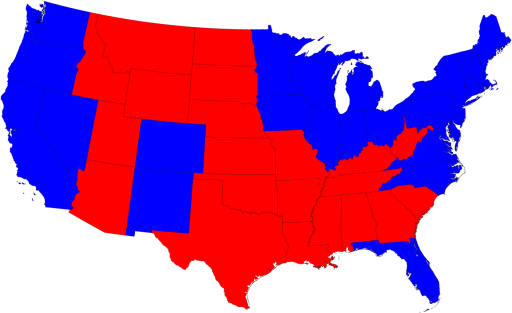
Mark Newman, of the University of Michigan Department of Physics and Center for the Study of Complex Systems, has once again developed some interesting visualizations of the latest election outcome. He examined the traditional red-state/blue-state view:


and then went on to a cartogram of the same, based on population:


However, this only accounts for popular vote. Newman also, interestingly, shows us a cartogram of vote by electoral college, where for example we can note Wyoming as doubling in size.

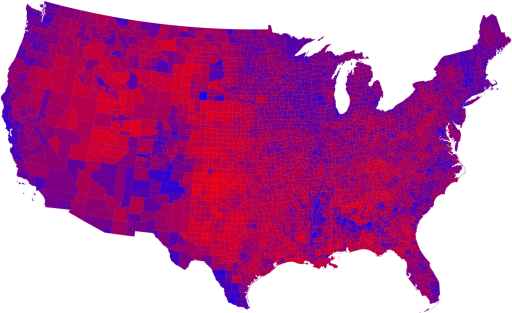
The next set of visualizations deals with county-level views, to drill down to the next level below states - here the urban/rural divide can be noted, as well as some other geographic trends.

Newman also provides further nuance, with a series of maps and cartograms showing a linear graduated color scheme, based on percentages of voters voting either Republican or Democrat:


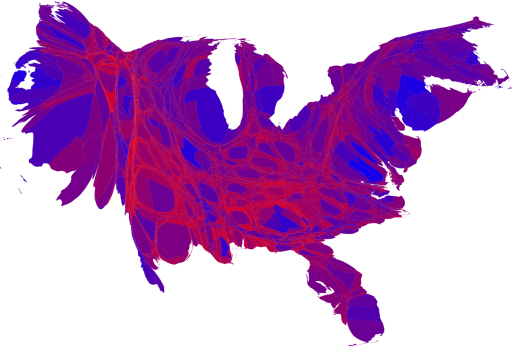
And then, a population-based cartogram of the same:


Newman provides considerable additional insight and several more maps and visualizations at his website: http://www-personal.umich.edu/~mejn/election/2008/.

UPDATE: Per Andy Anderson on the NEARC-L listserve (Northeast Arc Users Group),
The Gastner-Newman cartogram software has been implemented as an ArcScript by ESRI's Tom Gross: http://arcscripts.esri.com/details.asp?dbid=15638

'Twas the Eve before Election Day...

Posted by Dave Smith On 11/03/2008 12:59:00 PM 0 comments

As we come up on this eve before Election day, I will pass along this humorous, yet true item from my friend Gene Kooper, Executive Director of the Professional Land Surveyors of Colorado.

The below topo map fragment is from the Georgetown, CO 7 1/2 minute quad topo. In case you think it's bogus, the NGS Data Sheet is included. Regardless of your political views, please exercise your right to vote.

Whether you believe the brass cap is just a "pimple on a Grand Ol' Mountain" or a "Proud Shining Beacon of Democracy" atop a minor hill in the shadow of the Continental Divide, it doesn't matter!

In the end, we are all Americans.

GET OUT AND VOTE TOMORROW!!


1 National Geodetic Survey, Retrieval Date = NOVEMBER 3, 2008
KK2035 ***********************************************************************
KK2035 DESIGNATION - DEMOCRAT
KK2035 PID - KK2035
KK2035 STATE/COUNTY- CO/CLEAR CREEK
KK2035 USGS QUAD - GEORGETOWN (1974)
KK2035
KK2035 *CURRENT SURVEY CONTROL
KK2035 ___________________________________________________________________
KK2035* NAD 83(1992)- 39 42 51.68709(N) 105 44 07.70429(W) ADJUSTED
KK2035* NAVD 88 - 3781. (meters) 12405. (feet) VERTCON
KK2035 ___________________________________________________________________
KK2035 LAPLACE CORR- -11.78 (seconds) DEFLEC99
KK2035 GEOID HEIGHT- -12.45 (meters) GEOID03
KK2035
KK2035 HORZ ORDER - THIRD
KK2035
KK2035.The horizontal coordinates were established by classical geodetic methods
KK2035.and adjusted by the National Geodetic Survey in January 1993.
KK2035
KK2035.The NAVD 88 height was computed by applying the VERTCON shift value to
KK2035.the NGVD 29 height (displayed under SUPERSEDED SURVEY CONTROL.)
KK2035
KK2035.The Laplace correction was computed from DEFLEC99 derived deflections.
KK2035
KK2035.The geoid height was determined by GEOID03.
KK2035
KK2035; North East Units Scale Factor Converg.
KK2035;SPC CO C - 513,640.813 894,210.473 MT 0.99999314 -0 08 54.6
KK2035;SPC CO C - 1,685,169.90 2,933,755.53 sFT 0.99999314 -0 08 54.6
KK2035;UTM 13 - 4,396,313.019 436,959.085 MT 0.99964893 -0 28 11.8
KK2035
KK2035! - Elev Factor x Scale Factor = Combined Factor
KK2035!SPC CO C - 0.99940919 x 0.99999314 = 0.99940233
KK2035!UTM 13 - 0.99940919 x 0.99964893 = 0.99905833
KK2035
KK2035: Primary Azimuth Mark Grid Az
KK2035:SPC CO C - GRINDAL 152 24 17.9
KK2035:UTM 13 - GRINDAL 152 43 35.1
KK2035
KK2035|---------------------------------------------------------------------|
KK2035| PID Reference Object Distance Geod. Az |
KK2035| dddmmss.s |
KK2035| KK2034 GRINDAL APPROX. 8.1 KM 1521523.3 |
KK2035|---------------------------------------------------------------------|
KK2035
KK2035 SUPERSEDED SURVEY CONTROL
KK2035
KK2035 NAD 83(1986)- 39 42 51.68858(N) 105 44 07.70290(W) AD( ) 3
KK2035 NAD 27 - 39 42 51.73222(N) 105 44 05.69354(W) AD( ) 3
KK2035 NGVD 29 (07/19/86) 3779. (m) 12398. (f) VERT ANG
KK2035
KK2035.Superseded values are not recommended for survey control.
KK2035.NGS no longer adjusts projects to the NAD 27 or NGVD 29 datums.
KK2035.See file dsdata.txt to determine how the superseded data were derived.
KK2035
KK2035_U.S. NATIONAL GRID SPATIAL ADDRESS: 13SDD3695996313(NAD 83)
KK2035
KK2035 HISTORY - Date Condition Report By
KK2035 HISTORY - 1903 MONUMENTED USGS
KK2035 HISTORY - 1956 GOOD USGS
KK2035
KK2035 STATION DESCRIPTION
KK2035
KK2035'DESCRIBED BY US GEOLOGICAL SURVEY 1956 (EEM)
KK2035'RECOVERED AS DESCRIBED.
KK2035'
KK2035'STATION LOCATED 2 MI. W. OF GEORGETOWN, ON REPUBLICAN MOUNTAIN.
KK2035'
KK2035'POINT IS BEST REACHED BY FOLLOWING TRAIL UP FIRST PROMINENT GULCH N.
KK2035'OF GEORGETOWN, JUST AT THE CITY LIMITS. FOLLOW THIS TO SUMMIT OF
KK2035'MOUNTAIN, THENCE S. ALONG RIDGE TO HIGHEST POINT.
KK2035'
KK2035'STATION MARK--STANDARD BRONZE TRIANGULATION TABLET CEMENTED IN SOLID
KK2035'ROCK NEARLY AT HIGHEST POINT OF MOUNTAIN, STAMPED ---DEMOCRAT
KK2035'1903-1956---.
KK2035'
KK2035'REFERENCE MARK NO. 1--STANDARD USBR (1936) BENCH MARK TABLET CEMENTED
KK2035'IN SOLID ROCK, 5.07 FT. DISTANT FROM STATION MARK,
KK2035'S 36 DEG 40 MIN W

Appalachian Electoral Dynamic?

Posted by Dave Smith On 5/04/2008 06:05:00 PM 1 comments

I just came across an interesting blog, which presents a different spin on election dynamics, in the aftermath of the primary we just had here in Pennsylvania -

Here, counties in blue represent larger wins for Hillary Clinton, whereas the green counties represent larger wins for Barack Obama... "Appalachia" is outlined in black.
During the 1992 presidential campaign, Democratic political consultant James Carville described Pennsylvania as "Philadelphia and Pittsburgh, with Alabama in between." - Now here's yet another similar analogy... I'm just presenting it as a Pennsylvania voter, reserving my own mix of comments, whether bemused or amused - I'll leave folks to draw their own conclusions...

"The Electoral Map" - http://theelectoralmap.com/

[edit - interestingly, the delineation of "Appalachians" on the map appears to concur more with congressional boundaries which generally touch on the Appalachian range]


Search