Surveying, Mapping and GIS

Exploring all aspects of mapping and geography, from field data collection, to mapping and analysis, to integration, applications development and enterprise architecture...

  • Geospatial Technology, End to End...

    Exploring all aspects of mapping and geography, from field data collection, to mapping and analysis, to integration, applications development, enterprise architecture and policy

EPA Environmental Information Symposium

Posted by Dave Smith On 12/29/2008 04:33:00 PM 0 comments

Earlier in the month, I attended the EPA's Environmental Information Symposium - While I didn't post any updates here during the conference, I will now take the opportunity to carry over some of the more fun posts that I made to the Ning site that was set up for the Symposium:
Wordle: Web 2.0 Themes for the EPA Environmental Information Symposium
"Liberate The Data"

A Web 2.0 Success Story: Apps for Democracy

I touched on this during my presentation:


  • “Smarter, Better, Faster, Cheaper: Pick 4” – Vivek Kundra, District of Columbia CTO


  • The District of Columbia published an Open Data Catalog: GeoRSS, XML, KML and other data types


  • They then posted a contest and allowed the public to build applications, built on their Open Data Catalog


  • RESULT: In 30 days: 47 new applications for the web, facebook and mobile clients, over $2,000,000 in development at a cost of $50,000 = over 4000% ROI


  • http://www.appsfordemocracy.org/

The Web is the Platform

As a potential future paradigm, web-enabled connectivity binds together disparate resources, across EPA program offices, regions, labs, both horizontally and vertically, by transparently supporting access to data, analysis and resources:


For external stakeholders, those EPA resources then similarly become transparent, as part of the "EPA cloud" on the web, whereby the public, whether academia, industry, state or other government alike can access available resources toward supporting their own business requirements, whether watershed stewardship groups, regulated reporting industry, ecology research in academia or others:

Merry Christmas

Posted by Dave Smith On 12/25/2008 10:12:00 AM 0 comments

An Apropos Christmas for Surveying and Mapping...

A great picture, posted by Mike Berry to the rpls.com message board...

Conjunction of December 2008

Posted by Dave Smith On 12/02/2008 10:20:00 PM 1 comments

We had overcast skies and not much of a good view last night, but tonight, I was greeted with a much better view of the conjunction of the Moon, Jupiter and Venus:


A lovely sight...

Magnetic Declination

Posted by Dave Smith On 12/01/2008 05:14:00 PM 1 comments


For folks working with historic deeds and bearing references, there are a number of tools available -


Additionally, there is a freeware tool available from Resurgent Software, which will compute historic declinations to 1600: http://www.resurgentsoftware.com/geomag.html

Further online tools and resources for geomagnetism and computation:

EDIT: And an additonal one suggested by Chuck Conley from Canada's Geological Survey

Environmental Information Symposium 2008

Posted by Dave Smith On 12/01/2008 03:58:00 PM 2 comments


I will be flying out to Phoenix, Arizona December 9th-12th, to attend the US Environmental Protection Agency's annual Environmental Information Symposium... This year, I will be participating on a panel, to discuss collaborative geospatial tools, web services and data publishing, integration and visualization frameworks for environmental science, such as Microsoft Virtual Earth and Google Earth. I am definitely looking forward to sparking some discussion and engaging more people who collect, manage, consume or make decisions based on environmental data... My particular interest at this point is not just in publishing data via open, standards-based (not just OGC, but REST, JSON and others), accessible, dynamic data resources, but also in modeling and analysis, and beginning to look at workflows toward solving a wide variety of environmental problems.

Last year, I got to have a lot of fun developing a turbo Virtual Earth integration in 36 hours, for the Puget Sound Information Challenge. To blow my own horn, my application was recognized by EPA's CIO as one of the most interesting contributions made to the effort. Needless to say, I am really looking forward to attending again this year.

The event will be held at the JW Marriott Desert Ridge Resort in Phoenix,

Can't attend in person? Live streaming will be available as well.

(and thanks to Sean Gillies...)

Penn State Geography - Interdisciplinary Conference

Posted by Dave Smith On 11/10/2008 02:02:00 PM 1 comments


From my colleagues at the Penn State Department of Geography:

Please share with colleagues or students who might be interested. Note that the conference is open to undergraduate as well as graduate students, and Sunday's session (sponsored by our SWIG -- Supporting Women in Geography--chapter) will focus on professional development/networking; former AAG President Jan Monk will be the keynote speaker.

The CFP is available as a PDF document at http://www.geog.psu.edu/noboundaries/noBoundaries2009_CFP_Poster_final.pdf

Additional information, including updates as available, can be found at http://www.geog.psu.edu/noboundaries

***********************************************


The graduate students of the Penn State DEPARTMENT OF GEOGRAPHY invite graduate & undergraduate students to present their research at our annual interdisciplinary conference, which takes place on Penn State's University Park campus Saturday, February 28-Sunday, March 1, 2009.

We welcome submissions on subjects including:

Politics, economics, and international development; Ecology and environmental sciences; History, culture, and society; Gender, race, class, and sexuality; Urban & rural policy and planning; Hazards, vulnerability, and global change; GIS, spatial analysis, and geovisualization.

What unites us (and hopefully you) is an attention to space and place, scale, and connections between the human and physical realms. If your research intersects with any of the above, please join us! (more

information: www.geog.psu.edu/noboundaries)


PAPER SESSIONS

Paper sessions will be organized along common themes with 20 minute timeslots (15 minute presentations followed by a 5 minutes of Q and A).

If you would like to present your research, send a title and abstract (250 words or less) to noboundaries@psu.edu.


POSTER SESSIONS

Graduate and undergraduate students are invited to present posters. Send a title and abstract (250 words or less) to noboundaries@psu.edu.

SPECIAL SESSION: BALANCING ON THE ACADEMIC LADDER—SUPPORTING WOMEN IN

GEOGRAPHY AND BEYOND

Creating supportive spaces for a diversity of women within academia is an ongoing process that involves personal and political action at a variety of scales. This year’s special session of the no)BOUNDARIES conference looks to acknowledge the successes as well as the challenges faced by those striving to create a more supportive academic environment for all women.

We are soliciting papers for panel sessions on the themes of:

- Life in the Department: Departmental Climate; Mentoring; Access to Information; Student Organizations (e.g. Supporting Women in Geography)

- Life Beyond the Department: Publishing; Work/Life Balance; Career Track; Outreach; Networking


These are merely suggested topics; we welcome any and all contributions.

Balancing on the Academic Ladder will consist of workshops as well as panel sessions to encourage the generation and exchange of creative ideas and strategies. Send paper abstracts to noboundaries@psu.edu.


Submission deadline for abstracts is February 1, 2009


Red States, Blue States...

Posted by Dave Smith On 11/06/2008 11:27:00 PM 0 comments

Mark Newman, of the University of Michigan Department of Physics and Center for the Study of Complex Systems, has once again developed some interesting visualizations of the latest election outcome. He examined the traditional red-state/blue-state view:


and then went on to a cartogram of the same, based on population:


However, this only accounts for popular vote. Newman also, interestingly, shows us a cartogram of vote by electoral college, where for example we can note Wyoming as doubling in size.

The next set of visualizations deals with county-level views, to drill down to the next level below states - here the urban/rural divide can be noted, as well as some other geographic trends.

Newman also provides further nuance, with a series of maps and cartograms showing a linear graduated color scheme, based on percentages of voters voting either Republican or Democrat:


And then, a population-based cartogram of the same:


Newman provides considerable additional insight and several more maps and visualizations at his website: http://www-personal.umich.edu/~mejn/election/2008/.

UPDATE: Per Andy Anderson on the NEARC-L listserve (Northeast Arc Users Group),
The Gastner-Newman cartogram software has been implemented as an ArcScript by ESRI's Tom Gross: http://arcscripts.esri.com/details.asp?dbid=15638

Posted by Dave Smith On 11/03/2008 05:42:00 PM 1 comments

What's on my mind?


From Wordle, populated with my Blog's atom feed, capturing the most recent blog entries. Wordle analyzes the content and assembles a collage of words, with emphasis placed on words not in common usage, according to how often these words are used... Geospatial... Mapping... Integration... Technology... A few little trends that I didn't expect, but all in all, good stuff.

'Twas the Eve before Election Day...

Posted by Dave Smith On 11/03/2008 12:59:00 PM 0 comments

As we come up on this eve before Election day, I will pass along this humorous, yet true item from my friend Gene Kooper, Executive Director of the Professional Land Surveyors of Colorado.

The below topo map fragment is from the Georgetown, CO 7 1/2 minute quad topo. In case you think it's bogus, the NGS Data Sheet is included. Regardless of your political views, please exercise your right to vote.

Whether you believe the brass cap is just a "pimple on a Grand Ol' Mountain" or a "Proud Shining Beacon of Democracy" atop a minor hill in the shadow of the Continental Divide, it doesn't matter!

In the end, we are all Americans.

GET OUT AND VOTE TOMORROW!!


1 National Geodetic Survey, Retrieval Date = NOVEMBER 3, 2008
KK2035 ***********************************************************************
KK2035 DESIGNATION - DEMOCRAT
KK2035 PID - KK2035
KK2035 STATE/COUNTY- CO/CLEAR CREEK
KK2035 USGS QUAD - GEORGETOWN (1974)
KK2035
KK2035 *CURRENT SURVEY CONTROL
KK2035 ___________________________________________________________________
KK2035* NAD 83(1992)- 39 42 51.68709(N) 105 44 07.70429(W) ADJUSTED
KK2035* NAVD 88 - 3781. (meters) 12405. (feet) VERTCON
KK2035 ___________________________________________________________________
KK2035 LAPLACE CORR- -11.78 (seconds) DEFLEC99
KK2035 GEOID HEIGHT- -12.45 (meters) GEOID03
KK2035
KK2035 HORZ ORDER - THIRD
KK2035
KK2035.The horizontal coordinates were established by classical geodetic methods
KK2035.and adjusted by the National Geodetic Survey in January 1993.
KK2035
KK2035.The NAVD 88 height was computed by applying the VERTCON shift value to
KK2035.the NGVD 29 height (displayed under SUPERSEDED SURVEY CONTROL.)
KK2035
KK2035.The Laplace correction was computed from DEFLEC99 derived deflections.
KK2035
KK2035.The geoid height was determined by GEOID03.
KK2035
KK2035; North East Units Scale Factor Converg.
KK2035;SPC CO C - 513,640.813 894,210.473 MT 0.99999314 -0 08 54.6
KK2035;SPC CO C - 1,685,169.90 2,933,755.53 sFT 0.99999314 -0 08 54.6
KK2035;UTM 13 - 4,396,313.019 436,959.085 MT 0.99964893 -0 28 11.8
KK2035
KK2035! - Elev Factor x Scale Factor = Combined Factor
KK2035!SPC CO C - 0.99940919 x 0.99999314 = 0.99940233
KK2035!UTM 13 - 0.99940919 x 0.99964893 = 0.99905833
KK2035
KK2035: Primary Azimuth Mark Grid Az
KK2035:SPC CO C - GRINDAL 152 24 17.9
KK2035:UTM 13 - GRINDAL 152 43 35.1
KK2035
KK2035|---------------------------------------------------------------------|
KK2035| PID Reference Object Distance Geod. Az |
KK2035| dddmmss.s |
KK2035| KK2034 GRINDAL APPROX. 8.1 KM 1521523.3 |
KK2035|---------------------------------------------------------------------|
KK2035
KK2035 SUPERSEDED SURVEY CONTROL
KK2035
KK2035 NAD 83(1986)- 39 42 51.68858(N) 105 44 07.70290(W) AD( ) 3
KK2035 NAD 27 - 39 42 51.73222(N) 105 44 05.69354(W) AD( ) 3
KK2035 NGVD 29 (07/19/86) 3779. (m) 12398. (f) VERT ANG
KK2035
KK2035.Superseded values are not recommended for survey control.
KK2035.NGS no longer adjusts projects to the NAD 27 or NGVD 29 datums.
KK2035.See file dsdata.txt to determine how the superseded data were derived.
KK2035
KK2035_U.S. NATIONAL GRID SPATIAL ADDRESS: 13SDD3695996313(NAD 83)
KK2035
KK2035 HISTORY - Date Condition Report By
KK2035 HISTORY - 1903 MONUMENTED USGS
KK2035 HISTORY - 1956 GOOD USGS
KK2035
KK2035 STATION DESCRIPTION
KK2035
KK2035'DESCRIBED BY US GEOLOGICAL SURVEY 1956 (EEM)
KK2035'RECOVERED AS DESCRIBED.
KK2035'
KK2035'STATION LOCATED 2 MI. W. OF GEORGETOWN, ON REPUBLICAN MOUNTAIN.
KK2035'
KK2035'POINT IS BEST REACHED BY FOLLOWING TRAIL UP FIRST PROMINENT GULCH N.
KK2035'OF GEORGETOWN, JUST AT THE CITY LIMITS. FOLLOW THIS TO SUMMIT OF
KK2035'MOUNTAIN, THENCE S. ALONG RIDGE TO HIGHEST POINT.
KK2035'
KK2035'STATION MARK--STANDARD BRONZE TRIANGULATION TABLET CEMENTED IN SOLID
KK2035'ROCK NEARLY AT HIGHEST POINT OF MOUNTAIN, STAMPED ---DEMOCRAT
KK2035'1903-1956---.
KK2035'
KK2035'REFERENCE MARK NO. 1--STANDARD USBR (1936) BENCH MARK TABLET CEMENTED
KK2035'IN SOLID ROCK, 5.07 FT. DISTANT FROM STATION MARK,
KK2035'S 36 DEG 40 MIN W

Happy Halloween!

Posted by Dave Smith On 10/31/2008 10:45:00 AM 0 comments

Happy Halloween!

Mapping Integration with BusinessObjects

Posted by Dave Smith On 10/10/2008 11:08:00 AM 1 comments

I got to spend a little time in the last week or two examining integration of web mapping with BusinessObjects XI R2 Web Intelligence, for a little turbo proof-of-concept application - I hadn't seen many folks talking about integrating web mapping and BO, so I figured I would share my own experiences. Though I'm certainly no BusinessObjects guru, I was able to successfully do some basic integration, with the help of the BusinessObjects "Masher" application available on their "Labs" site: http://labs.businessobjects.com/mashup/default.asp.

What BusinessObjects presents via the Masher is a dynamically-named div tag, which is accessible via container in JavaScript, which is where your rendered DHTML content needs to be targeted. They also then present three basic functions for housing and executing all user-developed JavaScript, init(), mash() and dispose() - the intent of which is self-evident. They also provide some JavaScript objects, pivot and parameters - pivot contains the BO report table contents, and parameters contains values that can be preset and/or passed when initializing or formatting the template.

So, essentially just a matter of figuring out what's available to latch on to and use - and how to leverage what BO provides to permit building the application. For this proof-of-concept, there had been some discussion and interest in Google Maps from the customer, so - for the sake of simplicity, I chose to just stick with Google Maps. In reality, I'd be fairly confident in suggesting that virtually any web mapping framework that supports DHTML and JavaScript should be usable with this same approach, e.g. OpenLayers, Microsoft Virtual Earth, or others.

So, ultimately - the results:

"Turn table into..." (the intent being as simple as "click a button to turn this table or graph into a map")

Being a table, the application has to be able to understand and use designations in the underlying table, from it's "geography" dimension such as "AZ" to latch on to the appropriate mapping geographies. So... Turn map into...


Here, I have my newly published template showing up among the choices as "Google Maps Equal Interval Polygonal Choropleth Map", and click on "OK" - Et voila!


For this quick-and-dirty proof of concept, I just wrote some JavaScript that examines the array of pivot data and the range of values, and then just does some quick calculations to create a lookup table and legend. One trick was to dynamically rewrite BO's generic container div tag to embed two new div elements inside of it, one which I use to hold the map, and a second, which I use to hold my legend - other elements as well as a hidden control panel could be embedded here also.

For generating the classification and legend, a similar type of logic and approach could of course also be applied to a variety of classification schemes such as standard deviations, natural breaks, and so on. I then examine the pivot table to see what geographies are represented, display them on the map rendered with their appropriate hex color values matching their respective measures from the lookup table and add a Google Maps openWindowHtml popup for the click event handler for each location. Within the pivot object, labels are also provided - and given a table with multiple columns of measures, these could either be managed with code to run analysis on both, just thematically map the first, and display the remainder in the popup, and so on - a variety of possibilities for the adventurous coder.

Want to change the number of classification breaks? Didn't like the color scheme?

Within the template, there is opportunity to define parameters - here I set it up to allow me to change the number of classification breaks, starting color, ending color, and so on. And the BO folks nicely even include a color picker. So, for example, I can then retrieve parameters.startColor as a hex value, split it into RGB values and compute even jumps for my color ramp to parameters.endColor, based on the parameters.numBreaks value that the user specifies.

Like so... (deliberately odd colors selected to show the difference...)


Additionally, mash() fires every time the underlying table's filters or results are changed, which is nice, as the map updates accordingly.

Some additional development insights - I decided to keep a lot of my functions in an external .js library - one issue I encountered is that, given everything was encapsulated in the three BO Masher functions init(), mash() and dispose(), whenever I needed to create and use global variables, I needed to do so explicitly, e.g. window.myVarName. Additionally, I noted that BusinessObjects XI R2 uses the dojo JavaScript library... so for fans of dojo, that also provides a great deal of functionality and capability to leverage. As with anything, potential collision with other pieces of code or cross-browser compatibility issues are also a question, but through judicious naming conventions and error handling, these can generally be addressed.

So, while perhaps my turbo solution may not the most elegant, it's nonetheless illustrative that web mapping integration into a BO platform is definitely doable and definitely functional, in this case developed in just a few days' time with a little quick hackery, even for someone who may have web mapping expertise but little prior integration or development experience with a platform like BusinessObjects (such as myself in this instance) - hopefully this will be an encouragement to others who are looking to merge BI tools with geospatial technology, and likewise, hopefully the BI folks will continue to increasingly see the value of geospatial visualization in addition to their charts, graphs and dashboards. I have already seen some very interesting visual geographic trends popping out of the data, which is definitely not anywhere near as evident in some of the more standard BI views. Other possibilities include drilldown, however I found that the masher does not handle hyperlinks embedded in tables well - but within BO, URL-driven access to reports to allow drilldown is definitely a possibility as well.

What the future of the BO Masher is in the future is uncertain, but the potential use case and benefit of such integration is substantial.


In the long run, there will definitely be an ever-emergent intersect between these technologies and tools. All in all, another fun little proof-of-concept. Next, I may want to take on BusinessObjects Xcelsius 2008 and Flex-based integration with web mapping frameworks - will remain to be seen, depending on how various other projects go over the next few months...

MetaCarta Public Sector User Group Meeting

Posted by Dave Smith On 9/30/2008 08:59:00 PM 0 comments

MetaCarta is holding a users group meeting next week, October 8th - from their site:


MetaCarta Public Sector User Group Meeting 

How often can you hear key geospatial analysis findings from defense, intelligence, federal civilian, and industry analysts under one roof, in one day?

On Wednesday, October 8, 2008, MetaCarta invites you to join us for the 4th Annual MetaCarta Public Sector User Group Meeting as intelligence officers, industry analysts, and other senior executives share their geospatial technology experiences.

This is a perfect way to decompress from the Fiscal Year end, and come away with proven geospatial technology examples to employ within your own agency or organization.

Don't miss your chance to gain insight from industry experts including:

  • Jeff Vining, Research VP, Homeland Security and Law Enforcement, Gartner Research
  • Terry Busch, Senior Intelligence Officer, Defense Intelligence Agency
  • Dave Sonnen, Senior Consultant, Spatial Information Management, IDC Research
  • Dr. Jerry Johnston, Geospatial Information Officer, EPA / OEI

Collaborate with partners and colleagues to learn about best practices and take away critical knowledge about the latest uses and trends around geospatial intelligence, geosearch, and information retrieval. Hear about the “geoweb” and how MetaCarta exposes intelligence that would have been impossible to find any other way.


Highlights:


  • Share experiences and uses of MetaCarta technology
  • See the convergence of open source content and analysis
  • View in-depth customer presentations
  • See the updated 2008 / 2009 product roadmaps
  • Learn custom integration tips & tricks 
http://www.metacarta.com/geo-overview.htm


Farm Bill Prevents Sharing of Geospatial Data?

Posted by Dave Smith On 9/28/2008 12:16:00 PM 5 comments

I just came across this bit of disturbing information - a colleague was seeking historic aerial photographs from USDA, and was greeted with the following response:

"Please refer to Title 1, Subtitle F, Section 1619 titled "Information Gathering" on pages 256-259. This will give you the precise language of the 2008 Farm Bill which prevents FSA from providing geospatial information."

The bill is available here: http://www.usda.gov/documents/Bill_6124.pdf

The pertinent language is below:

SEC. 1619. INFORMATION GATHERING.

(a) GEOSPATIAL SYSTEMS.—The Secretary shall ensure that all the geospatial data of the agencies of the Department of Agriculture are portable and standardized.

(b) LIMITATION ON DISCLOSURES.—

(1) DEFINITION OF AGRICULTURAL OPERATION.—In this subsection, the term ‘‘agricultural operation’’ includes the production and marketing of agricultural commodities and livestock.

(2) PROHIBITION.—Except as provided in paragraphs (3) and (4), the Secretary, any officer or employee of the Department of Agriculture, or any contractor or cooperator of the Department, shall not disclose—
(A) information provided by an agricultural producer or owner of agricultural land concerning the agricultural operation, farming or conservation practices, or the land itself, in order to participate in programs of the Department; or
(B) geospatial information otherwise maintained by the Secretary about agricultural land or operations for which information described in subparagraph (A) is provided.

(3) AUTHORIZED DISCLOSURES.—
(A) LIMITED RELEASE OF INFORMATION.—If the Secretary determines that the information described in paragraph (2) will not be subsequently disclosed except in accordance with paragraph (4), the Secretary may release or disclose the information to a person or Federal, State, local, or tribal agency working in cooperation with the Secretary in any Department program—
(i) when providing technical or financial assistance with respect to the agricultural operation, agricultural land, or farming or conservation practices; or
(ii) when responding to a disease or pest threat to agricultural operations, if the Secretary determines that a threat to agricultural operations exists and the disclosure of information to a person or cooperating government entity is necessary to assist the Secretary in responding to the disease or pest threat as authorized by law.

(4) EXCEPTIONS.—Nothing in this subsection affects—
(A) the disclosure of payment information (including payment information and the names and addresses of recipients of payments) under any Department program that is otherwise authorized by law;
(B) the disclosure of information described in paragraph (2) if the information has been transformed into a statistical or aggregate form without naming any—
(i) individual owner, operator, or producer; or
(ii) specific data gathering site; or
(C) the disclosure of information described in paragraph (2) pursuant to the consent of the agricultural producer or owner of agricultural land.

(5) CONDITION OF OTHER PROGRAMS.—The participation of the agricultural producer or owner of agricultural land in, or receipt of any benefit under, any program administered by the Secretary may not be conditioned on the consent of the agricultural producer or owner of agricultural land under paragraph (4)(C).

(6) WAIVER OF PRIVILEGE OR PROTECTION.—
The disclosure of information under paragraph (2) shall not constitute a waiver of any applicable privilege or protection under Federal law, including trade secret protection.

Pentagon 9/11 Memorial

Posted by Dave Smith On 9/12/2008 11:01:00 AM 0 comments

I was in Crystal City for some business yesterday, and afterward went over to the Pentagon.

Adjoining the dedication area, a sea of flags...


Each step in the wall, representing the age of one of the victims...


Each bench, representing one of those 184 who died here that day...


to the youngest of the young, a mere 3 years old...


The bell that tolled when the names were read out...


A flag draped where the plane impacted...

I prayed for all those who lost their lives on 9/11

I prayed for all those who have lost their lives since

I prayed for the surviving friends, family and colleagues

I prayed for our children, for our nation, and for our future

The Lost Maps of Nagaland

Posted by Dave Smith On 9/10/2008 06:58:00 PM 0 comments


The Times of India brings a story, speaking to the necessity of preserving maps and records dealing with boundaries - apparently the official maps depicting the boundary of the Indian state of Nagaland have gone completely missing.

Nagaland is a hill state in the foothills of the Himalayas, located in the far northeast of India, adjoining the Indian states of Assam, Arunachal Pradesh and Manipur, and bordering Myanmar (formerly Burma) to the east.

From the article,


The government has lost all "original documents" — comprising details of boundaries — of Nagaland, in a glaring instance of callous handling of vital public documents.

The Union home ministry and the Assam government, which originally kept the records of Nagaland, do not even have the valid "map" of the state which ironically is in the throes of violence sparked by the demand to carve out Greater Nagaland by extending the existing boundaries of the state.

The matter came as a shock to home ministry officials when it was brought to light for the first time by Nagaland during its submission before the Local Commission on the Assam-Nagaland Border here last week.

In response to the commission's direction to submit before it the original documents of the state to settle boundary disputes, Nagaland said it was not in a position to give the written statement unless "its original documents which were purportedly lost by Assam" were returned.
At present, it looks like some of the details of the boundary will have to be recreated from surveys and whatever remaining documentation can be salvaged. The region has not been without its share of historic boundary disputes.

New iPhones are out...

Posted by Dave Smith On 7/11/2008 04:55:00 PM 2 comments

Was just a little over a year ago that I shrugged at the release of the iPhone... Finally, they are coming through with some of the things I suggested quite a while back, primarily


  • True GPS

  • 3G data connection vs. EDGE

Almost as good as my AT&T Tilt now, but still doesn't run all of the mobile GIS apps I have.


A Compendium of State Land Surveying Practice Acts

Posted by Dave Smith On 7/06/2008 06:37:00 PM 2 comments

To follow on to my previous post, "Epic Battles: GIS versus Land Surveying?" I have compiled this list of Land Surveying Practice Acts. These are state laws, which govern the practice of land surveying within each jurisdiction, and which define what each jurisdiction views as work to be performed by licensed land surveyors.

Epic Battles: GIS vs. Surveying?

Posted by Dave Smith On 7/05/2008 11:15:00 AM 9 comments

Discussion revolving around a planned, but retracted article on GIS for Professional Surveyor Magazine has led to a lot of interesting discussion, but to me generally reveals a continuing underlying tension and misperceptions between the GIS and Surveying communities.

Adena Schutzberg / All Points Bulletin: Update: State Licensing Board "Censors" GIS Article
James Fee / Spatially Adjusted: "GIS Practitioners as Doing Work Surveyors Should Be Doing"

While these articles post updates and amendments, based on comments by Tom Gibson, Professional Surveyor's editor, which clarifies that the author decided to retract his article, the underlying question of GIS versus surveying and legal jurisdictions still remains.

Some of the comments are telling - with perceptions and suggestions that State Licensing Boards are somehow cracking down in draconian fashion, demanding censorship and attacking GIS practitioners. Tied into this, we had the MAPPS lawsuit (another issue which I believe will resurface at some point), overlap of surveying with photogrammetry, and other issues. Meanwhile, in the surveying community, we still hear "GIS = Get It Surveyed".

I have my own, perhaps unique perspectives and insights, being a GIS practitioner since the late 1980s, as well as a licensed Land Surveyor, and finally, also serving as chair to a State Licensing Board.


Note: Having said this, please note that my comments to follow are my own personal views, and are not to be taken as official statements or in any way representative of our State Licensing Board's views.

For most GIS practitioners, they readily defer to surveyors' knowledge and domain expertise on cadastral issues - matters of how property boundaries are properly dealt with, and so on - and similarly, most surveyors know their limitations when it comes to GIS. However, there still seems to be occasions which give rise to confusion and misperception.

One basic thing that we all need to come into reckoning with is that Surveying and GIS overlap, but that neither is wholly contained within the other, and that each has areas which may additionally be mutually exclusive from the other. Another part of this Venn diagram equation is Photogrammetry - another topic, which has come up often. I have best seen it illustrated as such:


One area of contention is that some states' Practice Acts are very broad in their definition of what constitutes land surveying - e.g. "measurement and determination of any feature on the earth's surface" - which might not be appropriate for the strictest of interpretations. Many everyday GIS efforts could constitute surveying practice under this definition - but is it appropriate?

If one considers typical State laws pertaining to licensure and practice of land surveying, one will see that the primary objective is in protecting the public, it has little to do with protecting the surveying profession.

So what is falls within the purview of licensing boards, and what falls within the definition of land surveying, toward preventing harm? That may vary somewhat from state to state.

But how might the public be harmed by GIS data, as opposed to proper land surveys? Here are some generalized versions of recent tales I've heard:
  • A county tax mapping office, where a GIS practitioner "helps" a realtor friend in a bind by preparing a property description based on lot lines in the GIS. Where did those lot lines come from? Combination of digitized paper maps, lines rubbersheeted to apparent fencelines on orthophotos, and so on. The harm? This description brings with it apparent legal connotation, as a representation of lines of ownership. The buyer may be getting a misrepresentation of what the lot's actual extent and location is.

  • A municipality orders a homeowner to demolish and remove a brand new addition, based on their perception that it is in violation of setback lines - based on the GIS.

These things can be only be remedied through a proper survey. One definite question that should be asked, is whether litigation or legal action might ever be a possibility. If it's anything relating to or impacting property ownership and use, such as property boundaries, rights-of-way, easements, or things of that nature, one would definitely want reliable, accurate survey data that can hold up in a court of law. Most county GIS systems will not pass this test.

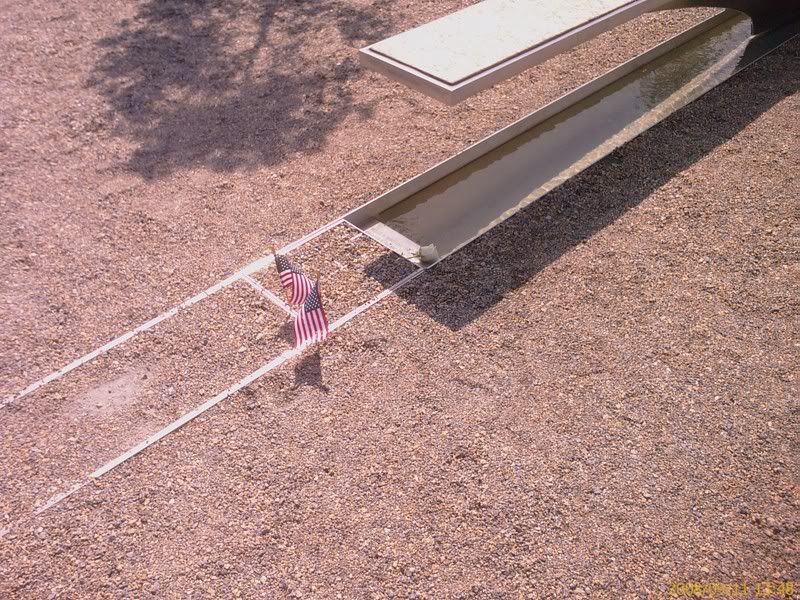
Perhaps there a jurisdictional issue at stake, such as wetlands delineation (where US EPA, Army Corps of Engineers, State Environmental Protection Agencies or others may or may not have jurisdiction, based on whether or not the land in question is a wetlands or not). Given an instance where a wetland may have been filled, drained, or otherwise encroached upon, and where the original physical evidence of plants, hydric soils, and wetlands flags may no longer exist, a surveyor's location of and ties to the wetland biologists' flags is far more likely to hold up to scrutiny, be accurately retraceable in the field, and be defensible in court than GIS data from recreational-grade GPS receivers or other approaches that are occasionally seen in use.

Or a toxic waste spill - whether it impacted adjoining properties or not - and so on. The same circumstance may come into play with other jurisdictional issues, such as taxation and municipal jurisdiction, and other areas.

Is it a specific legal requirement that these types of data be collected by surveyors in these cases? To turn that question around, in these cases it's instead a matter of basic good practice and adequate protection from dispute and liability as to how the locational data is captured.

Not every GIS practitioner has to deal with these things - but some do very much need to be cognizant of it. And certainly GIS practitioners do need to be aware of state Land Surveying Practice Acts in any regard. Ambiguities will not be resolved overnight - certainly questions of "what DOES that cadastral GIS system really represent" will continue to come up again and again. And certainly many stewards of cadastral GIS are aware of this, and put as many protections in place as they are able to - such as disclaimers and metadata, but for most citizens and casual users of the data, the phrase "consult the metadata" will only lead to glazed eyes. And while GIS systems are fully able to accomodate survey-grade data, and while some nations have made great strides toward a coordinated cadastre, here in the United States, the approach has been far more piecemeal, with varying degrees of robustness in how cadastral data can be improved. I have suggested record-level metadata for parcel data and similar approaches to allow refinement, where good, vetted, survey-grade locational data can be utilized and held toward iterative acquisition of a uniformly high-quality database. The locational accuracy of each parcel and subdivision can then be assessed on a case-by-case basis. Additionally, database linkages to plats and other survey data can be put in place.

Certainly not easy questions to answer overnight - but also hopefully I can share more insight and reality than perceptions that "Surveyors are trying to take over GIS".


Update: To follow up, I've put together and posted a "Compendium of State Land Surveying Practice Acts" with links to a number of jurisdictions' laws relating to the practice of land surveying.

GeoServer

Posted by Dave Smith On 6/21/2008 11:16:00 AM 6 comments

The last few months have been hectic, with a lot of proposal writing and other things flying around - and as I continue to redefine and revisit and look toward new types of approaches and ways to tackle problems in architecting geospatial solutions, I have been making an effort to poke around and look at alternatives. Some of the major drivers for alternatives are licensing costs - Oracle is certainly not cheap - and the others are technical, finding fast and easy ways to publish and interact with geospatial data, provide interoperability and consume it in a wider variety of clients, e.g. OGC Web Map Service, KML, GeoRSS and the like...

So of late, I have been digging deeper with a stack consisting of PostGIS, GeoServer and GeoWebCache - and I must say I am impressed with what I'm seeing so far:


Here, hundreds of thousands of facilities points, being served up by PostGIS and GeoServer, and published as a tile layer in GeoWebCache. Firstly, the production ArcIMS/Oracle boxes I've been using would be struggling to render this much data quickly. Secondly, it would take a custom tile server or other middleware to get them into Virtual Earth - yet here I was able to get these results, start to finish, in less than an hour.

Same data in Google Earth as KML, again GeoServer provides some very interesting and compelling out-of-the-box functionality...

Again, the question I have been asking myself is in what the solution needs to look like - and here, we can have some hybridized approaches, depending on how static or dynamic the data is, and how much analysis we want to do, perhaps with products like GeoWebCache and GeoServer serving base data and tiles, and ArcGIS Server 9.3 providing modeling and analytical capabilities. This coming year will be interesting, to say the least...

EPA GIS Workgroup

Posted by Dave Smith On 5/12/2008 09:37:00 AM 0 comments

While everyone else is off to Where, et cetera - I'm going off to the EPA GIS Workgroup meeting in New York City...


Always great to see what's going on in terms of GIS and remote sensing for visualization, modeling and analysis in the realm of environmental protection - usually most EPA regions and program offices are represented, along with other organizations and agencies... Lots of geo friends in attendance.

Looking forward to it.

US Streets

Posted by Dave Smith On 5/11/2008 06:53:00 PM 2 comments

This is an interesting view of the United States:

- found on Ben Fry's website, http://benfry.com/allstreets/index.html

The author compiled all local roads, and visual patterns of density and human use rapidly emerge. Here, a mix of physical barriers (such as valleys within the Appalachians) can be seen along with major corridors of development. There are still some blocks within some states which are not fully populated (shown as generally-rectangular, lighter-density areas in some of the midwest states), Fry ascribes this to differences in how roads are characterized and classified.

Why I Haven't Moved To The Beltway...

Posted by Dave Smith On 5/06/2008 11:00:00 PM 2 comments

Given most of my work is in the DC Beltway, and I have a 4 hour + "commute" one way - some of my friends and colleagues keep asking why I don't move south.

Simple answer... quality of life. I wouldn't be able to afford the great house that I have, I wouldn't have the great natural setting nearby...

I walk just a few houses down to the end of my block, and from there, I'm in a park - I can take a lengthy hike in any number of directions, a different hike for every day of the week... and the scenery?


More "photos of the day" to come...

Thematic Mapping

Posted by Dave Smith On 5/05/2008 09:52:00 PM 0 comments

After just spending a chunk of time tonight reading article after article on his site, I have to give my kudos to Bjørn Sandvik, and his blog, Thematic Mapping -

There's just a ton of eminently cool and accessible stuff for visualization there...

The latest buzz here in Northeastern Pennsylvania here in the last few months revolves around revised estimates of natural gas potential residing in the Marcellus Formation, which is a deep layer of black shale running throughout southern New York State, across Pennsylvania and into Ohio and West Virginia.

Per Wikipedia, the Marcellus Formation is believed to contain as much as 500 trillion cubic feet of natural gas, 10% of which may be recoverable using current technologies.


Notably here in Northeastern Pennsylvania, the Marcellus Formation is exceptionally thick, with some areas up to 350 feet thick - the map illustrates the extent of the Marcellus formation in grey, with isopach lines denoting layer thickness.

In terms of stratigraphy, the Marcellus Formation is part of the Hamilton Group, lying deep, however far deeper gas deposits are currently being developed elsewhere in the world.

While the economic boom is welcome - with one potential outcome being preservation of farmlands and forestlands in Northeastern Pennsylvania - in an area which has been struggling for some time, and while this deposit becomes a welcome find in an imminent energy crisis, the longer-term pros and cons are yet to be known - specifically, what are the potential environmental impacts, to aquifers, of hydrofracturing, impacts of surface activities - what needs to be done in terms of pipeline infrastructure, and so on...

Appalachian Electoral Dynamic?

Posted by Dave Smith On 5/04/2008 06:05:00 PM 1 comments

I just came across an interesting blog, which presents a different spin on election dynamics, in the aftermath of the primary we just had here in Pennsylvania -

Here, counties in blue represent larger wins for Hillary Clinton, whereas the green counties represent larger wins for Barack Obama... "Appalachia" is outlined in black.
During the 1992 presidential campaign, Democratic political consultant James Carville described Pennsylvania as "Philadelphia and Pittsburgh, with Alabama in between." - Now here's yet another similar analogy... I'm just presenting it as a Pennsylvania voter, reserving my own mix of comments, whether bemused or amused - I'll leave folks to draw their own conclusions...

"The Electoral Map" - http://theelectoralmap.com/

[edit - interestingly, the delineation of "Appalachians" on the map appears to concur more with congressional boundaries which generally touch on the Appalachian range]


Search