Surveying, Mapping and GIS

Exploring all aspects of mapping and geography, from field data collection, to mapping and analysis, to integration, applications development and enterprise architecture...

  • Geospatial Technology, End to End...

    Exploring all aspects of mapping and geography, from field data collection, to mapping and analysis, to integration, applications development, enterprise architecture and policy

ESRI Federal User Conference Highlights

My recently-retired EPA friend and colleague Dave Wolf was the recipient of the "Making a Difference" award. Dave was involved in pioneering efforts in web mapping at EPA, with EnviroMapper and other efforts.

I unfortunately arrived a bit late, and missed the discussion of ArcGIS Explorer Build 900 - fortunately Jithen Singh has a good overview of it here: http://mandown.co.nz/esri/arcgis-explorer-build-900-showcased-at-the-esri-federal-user-conference-2009/

As I arrived, I noted that there was a big focus being put on integration between ArcGIS and remote sensing imagery capability, specifically with ENVI and IDL: http://www.ittvis.com/ProductServices/ENVI.aspx. Dan Zimble led into presentations showing some of this capability, particularly integration of IDL scripts with ModelBuilder

Other highlights and demos:

  • Time Layer Animation
  • Keyless License Manager capability
  • Microsoft Virtual Earth data as a subscription service
  • APIs: Demonstration of ArcGIS Server Flex API via Solar Boston map: http://gis.cityofboston.gov/solarboston/
In general, there seemed to be a big focus on themes mirroring very topical and current issues, particularly stimulus and infrastructure investment - in the case of Solar Boston, energy - another demonstrated "smart routing" for alternative-fuel vehicles, based on availability of CNG fuel.

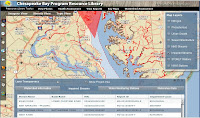
Relating to water issues, another demonstration featuring the Flex API was for the Chesapeake Bay Program: http://wdcb10.esri.com/cbprl/

This showed use of federated assets, such as USGS stream gauges, USEPA STORET water quality data, and so on, and provides many tools for assessment, management and best practices for improving water quality for the Chesapeake Bay.
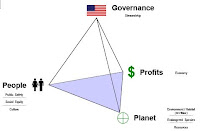
Colonel Alex Dornstauder of the US Army Corps of Engineers gave a good presentation on what USACE is doing relating to watersheds and water quality, using an approach of "3D decision space" and cross-agency "lenses". The approach utilized several different datasets and attributes with ModelBuilder to get a baseline assessment, which can then be utilized to in the target, with a collaborative vision to triage risk and prioritize investments to water quality.

(3d Decision Space image gleaned from a related presentation by Col. Dornstauder: http://gis.esri.com/library/userconf/ieug08/papers/watershed_dornstauder.pdf)

The Colonel closed with an excellent quote from George Washington, "Let us raise a standard to which the wise and honest can repair"

There was also discussion and demos of
  • Situational Awareness tools built on the Flex API in the code gallery (http://resources.esri.com)
  • ArcGIS Mobile SDK, with a demonstration, showing field data collection, domains, subtypes, dropdown list support.
  • 3D and network analysis - modeling of movement within a building in 3d (pedestrian egress via stairs, et cetera) - 3D proximity analysis
  • There was discussion of food safety, with a case study of the Hawaii Food Safety Center
  • Economic security and urban growth
  • Demonstration of ordinary least squares analysis vs. geographically weighted regression


Maryland Governor Martin O'Malley gave an excellent discussion, hitting many excellent notes - with many things that resonated: "can you show me my house" - which he tied in well in how "show me my house" repeatedly resonated in context of geography with the many case studies he presented. Other highlights "Maryland is ESRI Customer #008" -
He discussed trying to remedy many of the issues facing Baltimore, "hopeless & vacant hearts" and how CityStat http://www.baltimorecity.gov/government/citistat/ and iMap http://maps.baltimorecity.gov/imap/ have provided far more performance-oriented approaches - he touched on how previously, information had been collected in such a way as to not make it to management in any meaningful way, with emphasis on measurement of inputs, but not of outputs and outcomes - and the new paradigm of viewing outcomes against the map, tells where challenges lie. These types of geospatial approaches allow relentless followup and assessment, and drive the effort to move the graphs in right direction, with improvements in city services, reductions in shootings and homicides, improved response times - cleaning out and boarding of vacant houses, mapping service problems and opportunities for daily review. "The map does not care if neighborhood is white/black, rich/poor, republican/democrat"

As Governor now, he has taken this mapping-oriented and performance-oriented approach to the next level on a statewide level, with StateStat http://www.statestat.maryland.gov/ and BayStat http://www.baystat.maryland.gov/, and GreenPrint, which provides an ecological assessment of every single parcel in Maryland, along with ecological measures being put in force: http://www.greenprint.maryland.gov/ - and tie-in of stakeholders at all levels - "if it's not about the relationship, it's not about anything".

Governor O'Malley left the audience with a Native American proverb, "how we treat one another is reflected in how we treat the earth"

I did visit the EXPO floor and looked at some of the maps - the floor was definitely quite crowded. By one account, there were 2800 registrants this year for the ESRI Federal User Conference.

Some of the ESRI schwag:


(I don't think the DevSummit attendees will be getting ESRI umbrellas to go with their weather...)

As posted previously, I will try to live tweet more coverage tomorrow, using hashtag #feduc

If you are also attending and want to meet up, by all means, drop a line - dsmith (at) synergist-tech.com - while I have a few meetings, both inside, during FedUC, and a few outside meetings in the DC area next week, I will generally try to make FedUC my base of operations and will blog wherever conditions permit (if conference WiFi is available and/or my AT&T 3G service cooperates).

Also, I will try to post updates from my phone and laptop via Twitter - http://twitter.com/DruidSmith using the hashtag #feduc - if others are attending, I'd suggest using #feduc as well, tools such as TweetGrid will be helpful for tracking twitter traffic in realtime - here's a sample 1x1 TweetGrid already set up for tracking #feduc: http://tweetgrid.com/grid?l=0&q1=%23feduc

ESRI Federal User Conference

Posted by Dave Smith On 2/13/2009 08:09:00 PM 1 comments

I'm planning on attending at least part of the ESRI Federal User Conference next week - it's always good to get together with others working in the Federal community, to cross-pollinate ideas, talk, and see all the great things going on...

The details, from: http://www.esri.com/events/feduc/

GIS: The Geographic Approach for the Nation

Explore what geographic information system (GIS) technology can do for your agency at the largest geospatial conference dedicated to federal government. Whatever your GIS experience, the FedUC will give you the knowledge and resources you need to apply geography to problem solving, decision making, and accomplishing your missions.

Join other leaders, decision makers, and GIS professionals February 18–20, 2009, in Washington, D.C.

February 18–20, 2009
Walter E. Washington Convention Center
Washington, D.C.

Agenda-at-a-Glance

2009 Agenda [PDF]

Wednesday, February 18

9:30 a.m.–3:00 p.m. Plenary Session
2:30 p.m. Keynote Speaker
3:00 p.m.–6:00 p.m. GIS Solutions EXPO and Map Gallery Reception

Thursday, February 19

8:30 a.m.–5:30 p.m. Concepts of GIS Sessions

Paper Sessions

Technical Workshops
8:30 a.m.–5:30 p.m. Map Gallery
8:30 a.m.–6:00 p.m. Hands-On Learning Center
10:00 a.m.–4:00 p.m. GIS Solutions EXPO
4:00 p.m.–5:30 p.m. Industry Focus Session
5:30 p.m.–8:30 p.m. Thursday Night Social

Friday, February 20

8:30 a.m.–noon Paper Sessions

Technical Workshops

Industry Focus Sessions
9:30 a.m.–5:00 p.m. User Group Meetings
Noon–2:00 p.m. Closing Session

Who Should Attend and Why

Take the Geographic Approach

The FedUC is the ultimate resource when it comes to using geospatial technology in government. The conference offers presentations from technical and industry experts, valuable insight from your colleagues, and the latest solutions that fit your agency. Professionals across organizations are invited to discover effective and efficient ways to meet goals, overcome challenges, and address issues.

What You'll Experience

  • Hear from Jack
    Explore the future of GIS in government with ESRI president Jack Dangermond during the Plenary Session. Listen to him and a team of experts share what you can do with ArcGIS 9.3 in your organization. Plus, watch real-world demonstrations of ways government agencies are leveraging GIS.
  • Stay up-to-date
    Learn about the newest ArcGIS tools and capabilities. Hear firsthand from ESRI staff, your peers, solution providers, and consultants as you attend paper sessions, technical workshops, and the GIS Solutions EXPO.
  • Network with your colleagues and ESRI staff
    Build relationships with government and GIS professionals from both the public and private sectors as well as ESRI staff and business partners. Connect during sessions, exhibit times, and the evening reception.
  • Increase your knowledge of GIS
    Discover more about how GIS works and what it can do for your team and agency. See ways GIS is being used—from data sharing to security to budget control. Attend presentations given by professionals from across the nation and learn about successful implementations, best practices, tips, and tricks.
  • Learn how to meet your agency’s needs
    From compliance and accountability to visualizing patterns and trends, find out how taking the geographic approach improves your operations and decisions. Whether you work in federal, state, or local government, see how GIS can meet your organization’s unique needs.
  • Examine the most advanced technology
    Experiment with state-of-the-art tools you can use right away. Learn about recent developments for geotechnologies in your fields, from hardware, software, and data solutions to innovative applications and services.
  • Get your questions answered
    Pose your questions about GIS software, data, and implementation to ESRI staff members. Meet for a quick one-on-one discussion or set up a meeting to brainstorm and discuss project plans.

See geography in action.

If you are also attending and want to meet up, by all means, drop a line - dsmith (at) synergist-tech.com - while I have a few meetings, both inside, during FedUC, and a few outside meetings in the DC area next week, I will generally try to make FedUC my base of operations and will blog wherever conditions permit (if conference WiFi is available and/or my AT&T 3G service cooperates).

Also, I will try to post updates from my phone and laptop via Twitter - http://twitter.com/DruidSmith using the hashtag #feduc - if others are attending, I'd suggest using #feduc as well, tools such as TweetGrid will be helpful for tracking twitter traffic in realtime - here's a sample 1x1 TweetGrid already set up for tracking #feduc: http://tweetgrid.com/grid?l=0&q1=%23feduc

I am hoping to catch the Plenary, and am hoping to see what discussion ensues relating to the passage of the Stimulus bill, infrastructure investment and planning and National Spatial Data Infrastructure - I also hope to see old friends, and am looking forward to it...

NSDI for Democracy

Posted by Dave Smith On 2/07/2009 03:13:00 PM 0 comments

With news of Vivek Kundra joining the Obama administration to serve the Office of Management and Budget (OMB) as their top IT visionary, it brings me great encouragement. Vivek Kundra has been serving as the District of Columbia’s Chief Technology Officer, and he recently created some excitement through his Apps for Democracy initiative, where he pursued development of an “Open Data Catalog” containing over 250 data assets of various flavors (e.g. XML, Text/CSV, KML, ATOM/GeoRSS and ESRI Shapefile formats), and then promoted a contest wrapped around the Open Data Catalog, for development of innovative mashup-oriented applications. In just a short amount of time, 47 excellent applications were submitted, dealing with a broad range of topics and providing many innovative solutions, a great success.

So what is OMB all about – and what might Kundra’s joining OMB mean?
From Wikipedia, http://en.wikipedia.org/wiki/Office_of_management_and_budget

The Office of Management and Budget (OMB) is a Cabinet-level office, and is the largest office within the Executive Office of the President of the United States (EOP). It is an important conduit by which the White House oversees the activities of federal agencies. OMB is tasked with giving expert advice to senior White House officials on a range of topics relating to federal policy, management, legislative, regulatory, and budgetary issues. The bulk of OMB's 500 employees are charged with monitoring the adherence of their assigned federal programs to presidential policies. OMB performs its coordination role by gathering, filtering, and promulgating the President's annual budget request, by issuing bulletins, memoranda and circulars dictating agency management practices, by overseeing the "President's Management Agenda", and by reviewing agency regulations.

Executive oversight of federal agencies – via expert advice on federal policy, management, legislative, regulatory, and budgetary issues, to be implemented and monitored for adherence via the President’s Management Agenda. That’s quite powerful. And under the Bush administration, OMB has already begun engaging in some basic monitoring activities relating to geospatial technology and investments, under the Geospatial Line of Business (GeoLoB).

So where do we go from here? And what does Kundra’s selection mean in this mix? Only Kundra really has the answer to this, at present - however I do believe that we can make some informed guesses as to what may be on his mind, based on his past track record and accomplishments. District of Columbia’s Open Data Catalog? Think in terms of doing this across all of Federal government. Strengthen and bolster the existing OMB A-16 mandate, and drive publishing of open data. That certainly forms some excellent pieces of the National Spatial Data Infrastructure.

Foster partnership-building and collaboration, ala the Apps for Democracy effort. Perhaps, on a cross-government level, we should also be looking at approaches such as Forge.mil, where agencies can collaborate and share GOTS technology investments, and work together to enhance and expand technology and capability, as opposed to continually reinventing the wheel.

Other things for Kundra to look at? Alignment of efforts across government. Currently USGS and EPA collaborate on efforts to build and densify hydrology data, as the National Hydrology Dataset (NHD), and are working with states to get this to a 1:4,800 level. Meanwhile, FEMA is developing DFIRMs for flood mapping, based on county and other types of data for stream centerlines. How do we align such things as linear referencing between USGS stream gauges and FEMA for looking at flooding issues? Coordinate between NOAA and NWS for realtime storm tracking, and have models available, using all best-possible data, toward stream flood prediction? What if a truck tumbles off of a bridge and ends up in a river, releasing hazardous waste into the river – is the information flow adequate to deal with hazardous waste cleanup even where that river crosses the border into the next state downstream? Pieces and parts of these types of things are starting to happen, but where they do, it is typically only in an ad-hoc, reactive fashion, with very limited coordination or common framework. Where does one thing end and the next begin? What are the gaps? Overlaps?

Or, consider a military convoy, heading across multiple states to an exercise. Due to an emergency bridge closure, they are diverted off of the main highway and onto local roads. They may be carrying sensitive and/or high value goods, such as weapons systems. Who knows? Who SHOULD know? Perhaps local bridge weight restrictions restrict their travel even further. How do we handle this in any coordinated fashion? Who’s doing what, and who’s able to supply what data to smoothly deal with these types of situations? Federal government places some mandates on states to collect roadway data, but again, is there any mechanism for establishing data capture, transparent access and flow? What’s covered, and what isn’t? State-to-state, if there is a serious roadway closure issue just inside one state’s border, will the adjacent state know this and be able to notify motorists via VMS boards and other means?

Although there are a few exceptions here and there, more often than not, the answer to these types of questions and scenarios is “no/had no idea/what am I supposed to do about it” accompanied by shrugs. Streams do not care about political boundaries, they only understand watersheds. Roads are networks. Cars and trucks do not just reach the Edge of the Knowne Worlde and drift off into space when they cross the state line. Information access and flows must be able to bridge these gaps.

It’s pretty much a given that 90% of most business processes in Federal government touch on or deal with location in some form or fashion. Where are assets, where are people, who’s being served, and so on. Through implementation of best practices and through making data access and exchange more timely, transparent, and complete, through better alignment of technology investments and reduction of gaps and overlaps, these *shrug* moments start to vanish, and the *AHA* moments start to happen. I am hoping that Mr. Kundra is thinking the same way. If what lies ahead of us is anything like his efforts to date, we indeed have a bright future ahead of us.

As pressures of economics and tightening budgets, increasing population and infrastructure demands, and limited resources continue to confront states, municipalities, and the nation as a whole, some harsh realities begin to emerge, of how much we can actually, pragmatically accomplish.


As just one example of this, studies of number of vehicle lane miles traveled, compared to number of vehicle lane miles constructed and maintained shows a clear divergence, and sends the message that demand by far has been outstripping supply:

One solution to this would be to just try and keep building roads everywhere – however this is a simplistic, and ultimately unsustainable solution.  Certainly, we DO need to stabilize current infrastructure and address some critical physical issues of capacity bottlenecks, and in some instances we do need to improve circulation and flow in existing transportation networks.  But we also need to change our thinking, in terms of how we assess, monitor and manage traffic and congestion. 


Here, approaches such as use of Intelligent Transportation Systems can provide better visibility into traffic issues and offer solutions toward better management of the transportation network.  


Via any number of technologies, such as embedded sensors, cameras, on-board systems and GPS, message boards and other forms of providing traffic advisory data, and hazards monitoring, traffic crises can be averted, congestion can be managed, and traffic rerouted to make optimal use of existing transportation networks.  The use cases for embedded technology are numerous – while repairing or replacing our crumbling bridges, we can consider technologies to monitor bridge decks for icing conditions, and so on.  We can utilize available traffic data along with spatial, temporal and predictive analysis, e.g. virtual origin-destination studies and other approaches to recognize patterns and trends, toward avoiding traffic jams or even conditions which may be prone to promoting accidents.


As another example, decades of poor, unsustainable planning, zoning, and land development practices have promoted suburban sprawl, pedestrian-unfriendly areas, dependence on cars for even the most mundane of errands, particularly as residential and commercial areas have become separated from each other in artificial models.  In some areas, this has been recognized, as we see a return in some locales to “town center” concepts, where residents can find amenities within walking distance.  Here again, proper tools and geospatial data are required by planners to correct these planning paradigms on a macro scale to recognize these bedroom community relationships, as well as on a micro scale, for example to best maximize pedestrian travel and optimize these local networks.


Additionally, we need to continue to promote mass transit options, aligned to serve core needs – commuters, shopping, and similar needs, based on observation of current traffic flows.  If mass transit becomes enough of a convenience factor, it will continue to be utilized.  Similarly, other mass-transit-related infrastructure needs to be examined.  Here, spatial and temporal analysis of the network can reap great benefit toward maximizing mass transit networks and flows, their alignment to need (supply and demand for transit) and their efficiency.


These types of solutions are in need all around us - for example, as a regular visitor to the Washington, DC area, I often use their otherwise-excellent WMATA Metro system – however many demand issues and patterns rapidly become evident to even the casual eye– in out-lying areas served by the Metro, most of the parking lots and garages fill immediately in the AM and become deserted after work hours – a sign that commuters from outlying areas.  To anyone arriving at, say, 10AM, there’s a good likelihood that some of these parking facilities will be long filled, forcing potential users to travel further before being able to avail themselves of mass transit.  Here again, in even just expanding parking capacity, exists opportunity lost to get traffic off of the streets.


Even these types of things relating to commuting via Metro can also tie into Intelligent Transportation Systems, by providing parking advisories (e.g. saving commuters the grief of trying to find a space in a particular lot when parking may already be full) or by advising pedestrians right at street-level when the next train is arriving or of capacity issues (particularly when it may actually be worthwhile to just walk a few blocks to a different station); or by allowing better means of assessing travel options via web and/or location-aware mobile devices.  Here, geospatial approaches can even allow users to get custom travel directions and planning via walking, mass transit, or for handicapped persons, routing via ADA curb cuts, avoidance of stairs, steep inclines, and other useful information toward ensuring safe and reasonable travel, even delivered directly to their phone or other mobile devices.


With HR1 and discussion of massive infrastructure investments on the horizon, we strongly need to consider an integrated strategy and investment for integrated data and analysis, to include remote sensing, geospatial, temporal and others -  to go hand-in-hand with hard, bricks-and-mortar infrastructure investments – such that we may better manage the assets.  And yes, this could be done independently in dozens of disparate efforts, but would be best leveraged through discourse and technical coordination and information sharing on a broader scale to leverage planning capabilities, modeling, and much more; again, it points up the need for a national vision and strategy for spatial data infrastructure.


If we are going to do this at all, we need to get it right.


While efforts remain local, we need a paradigm shift on many levels- to think beyond our traditional project-by-project approach, and think on a bigger level, to integrate IT into our planning process, as well as integrating it directly into our bricks-and-mortar infrastructure investments, and to better coordinate and leverage investments and efforts to provide this long-term benefit.

< >

Landscape of National GIS...

Posted by Dave Smith On 2/01/2009 12:43:00 AM 4 comments

In considering the current state of geospatial data in the nation, it runs the gamut. A substantial amount of data is collected and developed at the local level. Some is collected and developed at the state and federal level, some by tribes, some by academia, some by non-profits, and some by private sector. Some of this data is generated on a regular basis, as part of an established program; some is purely on an ad-hoc basis. Some is mandated, such as some of the data collected on environmental data through the National Environmental Information Exchange Network, some is collected, purely incidental to other activities.

Some datasets exist on a national basis, some do not. And all throughout, there are myriad overlapping use cases, which may additionally place differing requirements on datasets. For example, in some cases, a roadway GIS dataset may be geared to roadway maintenance needs; in others, toward network and traffic analysis. In some cases, the requirements, dataset characteristics and attributes can converge and be accommodated in a single dataset. In others, they may not be able to converge, but the needed datasets can be developed by means of value-added attributes or joins. In some cases, derivative data is required. In many cases, there is tremendous need for consistency and authoritative datasets.

The landscape that quickly begins to emerge is one which is a patchwork, full of seams, overlaps, disjoints, gaps and disconnects- but- also one which holds much potential for leveraging disparate investments, and providing economies of scale, along with increasing richness of data, increased update frequency, increased accuracy and completeness.

How can these gaps and disjoints be bridged? Through a framework, forum and national dialogue, bringing together stakeholders at all levels – federal, state, local, tribal, academia, non-profit, and industry; through partnerships; through collaboration - organizations like NSGIC, like Federal and other agency GIS workgroups, like CUAHSI and many others. This is what holds a National Spatial Data Infrastructure together and brings success.  


The first step is in considering the concept.

Act Locally, Think Globally.

Search